 Miguel Escobar Published March 28, 2013
Executive: Are these values correct?
Excel-guy: yes, but you need to check the dates
slicers to see what dates the report is using
Executive: Ugh… I just want to click on the report and
see the latest values
If you ever had this situation before let me tell you that you’re not alone on that one…I’ve been there before and it’s time to give you some cool easy tricks on how to set up a Powerpivot report that shows you the yesterday, todays, tomorrow, next week or any type of timeframe (forecasting or that sort of scenario).
What could we do?
First, let’s analyze the situation and the possible solutions that we could provide:
- Teach the Executive to use slicers and how-to play with them (show him how fun that is!)
- You should always try to strive towards making the users feel more comfortable with the tools that they are using. But perhaps we could make things easier for them?
- Drag the DATES to the rows or columns and use the dates filtering option
- Probably the best option, but for this example let’s say that we don’t want to touch the aesthetics of the report or any type of layout in terms of the actual rows/columns and value field
- Create a DAX measure aka calculated field
- This could also be a great solution but it depends on how you want things to be calculated…we’ll talk about it later on
- Create a calculated column
- This will require you to add a column to your calendar table but it also depends on how you want things to be calculated
The solution!

The image above shows what the price for gas is today all over the world… (or what my eyes distinguish as prices)
Using the Dates as filters inside the pivot table
All you have to do is drag the DATES column into either the rows or columns, go to the filter section of it and then select the DATE FILTERS option to filter it as you need.

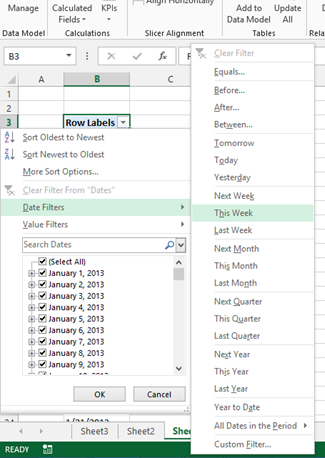
Excel Image – Image taken in a Sharepoint 2013 environment
Using TODAY() and NOW() – volatile functions
Using TODAY() will evaluate into Today’s Date and the NOW() function will evaluate into the date and time but…here’s the main question, when are those values being calculated?
When calculated inside the Powerpivot Grid (the powerpivot window)
It could be calculated automatically:
- Everytime you do a refresh for the data model or create a calculated column or field aka measure
Or it could be manually going through the
Design Tab > Calculation Options > Manual Calculation Mode
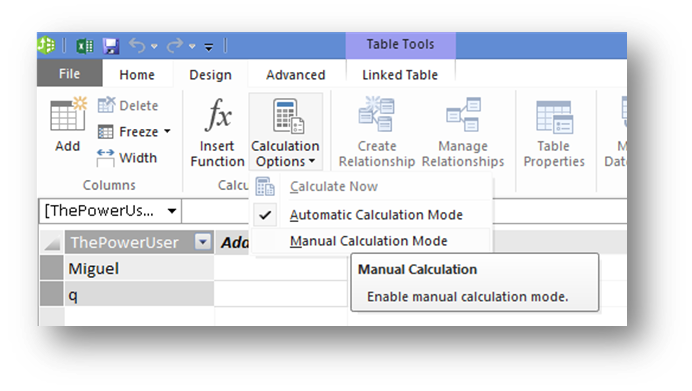
And then hitting the CALCULATE NOW button any time you need to calculate the values
When calculated as a measure or calc field
The exact moment that this value is calculated it’s when you refresh the pivot tables.
This concepts are necessary when you’re creating the solution as you’ll need to take in consideration these 2 questions:
- Do I want the TODAY’S or NOW’s date/time value to match the one for when my data model was last refreshed?
- Do I need to always have the latest date & time being calculated at the pivot table refreshing time?
It’s up to you to decide how to set-up the solution but after you get that part done, we can go ahead and create the solution!
We now know what we want to show in our reports, let’s go for the formula time!
DAX Measure aka Calc Field
The DAX measure or calc field approach would look something like this
=CALCULATE( SUM( FactTab[Sales] ),
FILTER( CalendarTable,
CalendarTable[Dates] = TODAY()
)
)
You could also make a variation on this and get current year or current month changing the column of the calendar table to Month# or Year# and using something like
MONTH( TODAY() ) or YEAR( TODAY() )
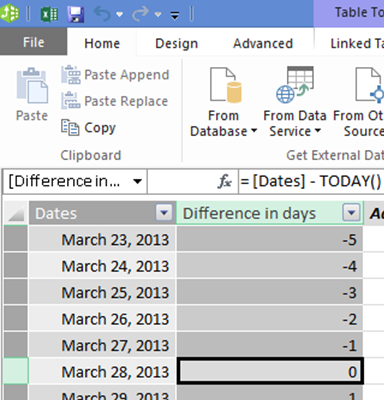
Calculated Column (Powerpivot Grid)
Using your Calendar Table you can use a new table like the following:
| Category | Diff |
| Yesterday |
-1 |
| Today |
0 |
| Tomorrow |
1 |
Where on the category you get the name that will appear in the slicers and on the column “Diff” the difference of days against TODAY()’s value. Once you have that table added to the data model you can then create a calc column on the calendar table using a formula like this:
= [Dates] – TODAY()
Once you have that covered you can now link that [Difference in days] calc column to the one on the table that we just added using the column Diff.
To finish, just add the slicer to your report and let the executive know that the slicer is now ready for its use and enjoy your first salary increase of 2013!


