 Miguel Escobar Published February 26, 2018
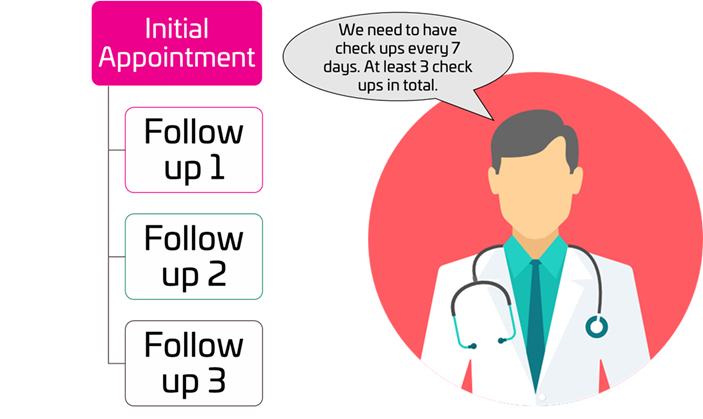
Imagine this scenario, you are a Doctor who has multiple appointments with patients on a daily basis. Sometimes, you need to schedule follow up appointments with your patients just to make sure that everything is going according to plan and basically do a check up.
You record these appointments in a simple spreadsheet like the following:
| Initial Appointment | Patient Name | Follow up Appointments Needed | Frequency (every x days) |
| 11-Jan-18 | Audie Livengood | 3 | 14 |
| 28-Oct-17 | Curt Gatz | 2 | 7 |
Where, for example, the first row is telling me that the patient under the name of ‘Audie Livengood’ had a initial appointment on January 11th of 2018 and needs follow up appointments every 14 days, for a total of 3 follow up appointments needed.
You want to calculate how your agenda might look like based on the appointments that you’re making and how many follow up appointments you’re needing on average per patient, so you want to use Power Query to calculate a table like the following:
| Initial Appointment | Patient Name | Follow Up Appointments Dates |
| 1/11/2018 | Audie Livengood | 1/25/2018 |
| 1/11/2018 | Audie Livengood | 2/8/2018 |
| 1/11/2018 | Audie Livengood | 2/22/2018 |
| 1/11/2018 | Audie Livengood | 3/8/2018 |
| 10/28/2017 | Curt Gatz | 11/4/2017 |
| 10/28/2017 | Curt Gatz | 11/11/2017 |
Can you do this with Power Query? Yes! you can
Step 1: Load the appointments table to Power Query
You can connect to the data however you want. In our case, we’ll be using a simple “From Table” Operation so we can load that data inside the ‘Query Editor’:

and one thing that you want to make sure once you’re inside the Query Editor is that your ‘Initial Appointment’ column is set to a ‘Date’ Data type as in some cases Power Query will automatically use a Date/Time instead of just Date.
Step 2: Create a new Custom Column
Here comes the magic. We need to head over to the ‘Add Column’ ribbon, click on the ‘Custom Column’ button and use the following formula:

=List.Dates(
Date.AddDays([Initial Appointment],[#"Frequency (every x days)"]),
[Follow up Appointments Needed],
Duration.From([#"Frequency (every x days)"])
)
Here we use the List.Dates function which requires 3 parameters:
- Initial Date
- in this case we are calculating the initial date based on what would be the first follow up appointment. To do that, we simply use the function Date.AddDays that simply adds a number of days to a date, so we uses the date that we have from [Initial Appointment] and the number of days that we get from the [Frequency] column
- Count
- The output of List.Dates is a list of dates. This parameter is used to determine how many dates/elements the list should have. We can simply use the value that we have in the [Follow up Appointments Needed] column since it already has the total number of dates that we need to have.
- Step
- This is where the offset comes in. You’d think that when creating a list of dates those dates NEED to be contiguous, but the truth is that they don’t need to be. You can have an offset based on days, as we see in this case. In this formula we’re telling List.Dates to come up with a list of dates that have an offset based on the value that we see in the [Frequency] column, but since the value inside that column is a number we use Duration.From to convert it into a duration value.
Step 3: Expand the [Follow Up Dates] Column

We use the ‘Expand to New Rows’ option and the end result will look like this:

Before you hit ‘Close & Load’, make sure that you set the Data Type to Date for this new column. Then you can load this data to a new table inside of Excel and start doing your analysis.
Step 4: Analyzing your Data
This whole post is based on one of the videos that I created for the Power Query Academy (you can join the FREE trial NOW!) and the end result looks more like this:

Where Ken and myself are the doctors and we’re trying to figure out how many patients we have on a daily basis just to make sure that we’re not being overbooked at one point. Of course, this is all fictional data, but it does have a real-life practice.
If you want to see the full example and the video companion, be sure to join the FREE trial of the Power Query Academy by clicking here.


