IMPORTANT: You can read the official documentation that Microsoft has on this topic from the following link (url).
Similar to the previous posts in this series, I highly encourage you to read the first 3 Parts ( 1 | 2 | 3 ) that I’ve published so far around Merge / Joins inside of Power BI / Power Query.
So far I’ve covered:
- Left Outer Join
- Right Outer Join
- Left Anti Join
In this, Part 4, we’ll go over the Right Anti Join from a purely practical standpoint.
Source Data
Similar to the previous posts, we’ll be using 2 tables this time:
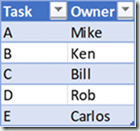
- OriginalTable – this is a table that has the tasks at hand at one point in our timeline
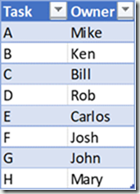
- NewTable – this table has the same format, but with rows added / updated at a later point in our timeline
The Goal
We want to compare the latest version of our Task table (NewTable) with the previous one to see what new tasks have been added or which ones are the new rows.
The result that we’re looking for should look like this:

The Solution
The following is a step by step process on how we can accomplish our desired result with nothing but a few clicks. No code needed – just the use of the Right Anti Join inside of Power Query / Power BI.
Loading the Data
You can follow along by downloading the sample file from the button below:
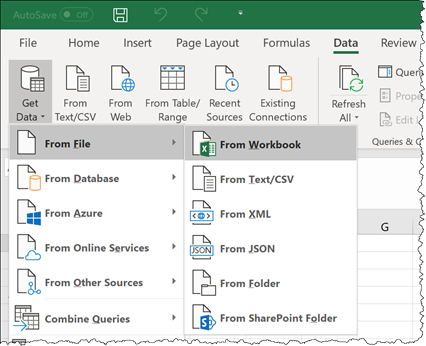
The first thing that we need to do is load both of those tables to Power Query / Power BI. To do that, we simply go to Data > Get & Transform Data > Get Data > From File > From Workbook:
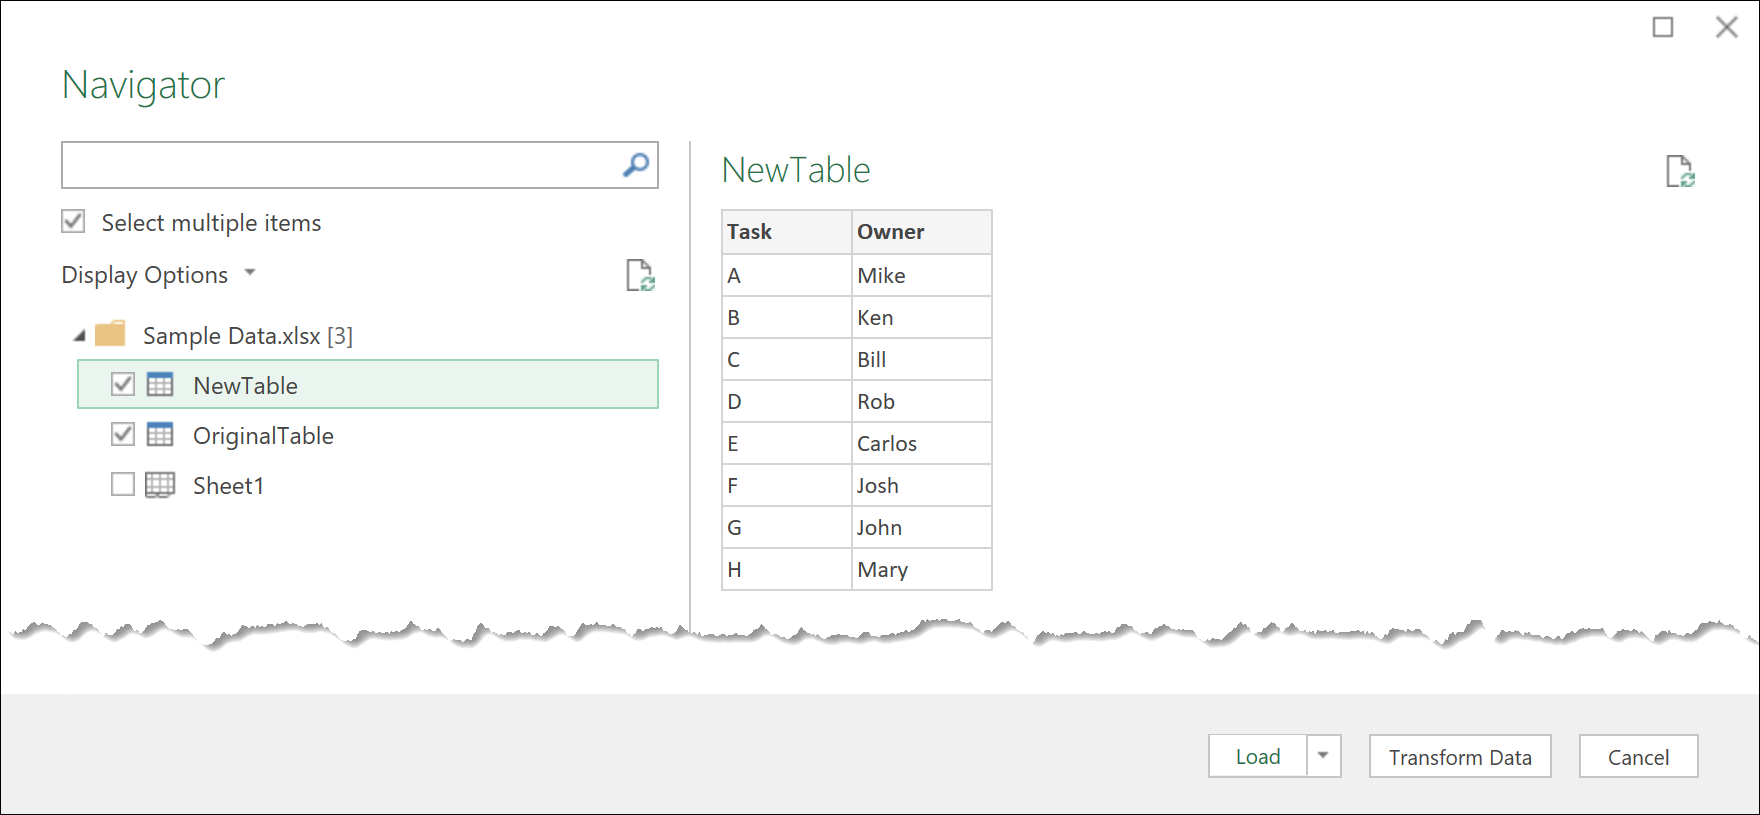
then we find the file that we downloaded (with the name of Sample Data.xlsx). We then select the option to “Select multiple items” and we select both the NewTable and OriginalTable tables:
and then we click on ‘Transform Data’ or ‘Edit’ depending on what version of Power Query / Power BI you might have.
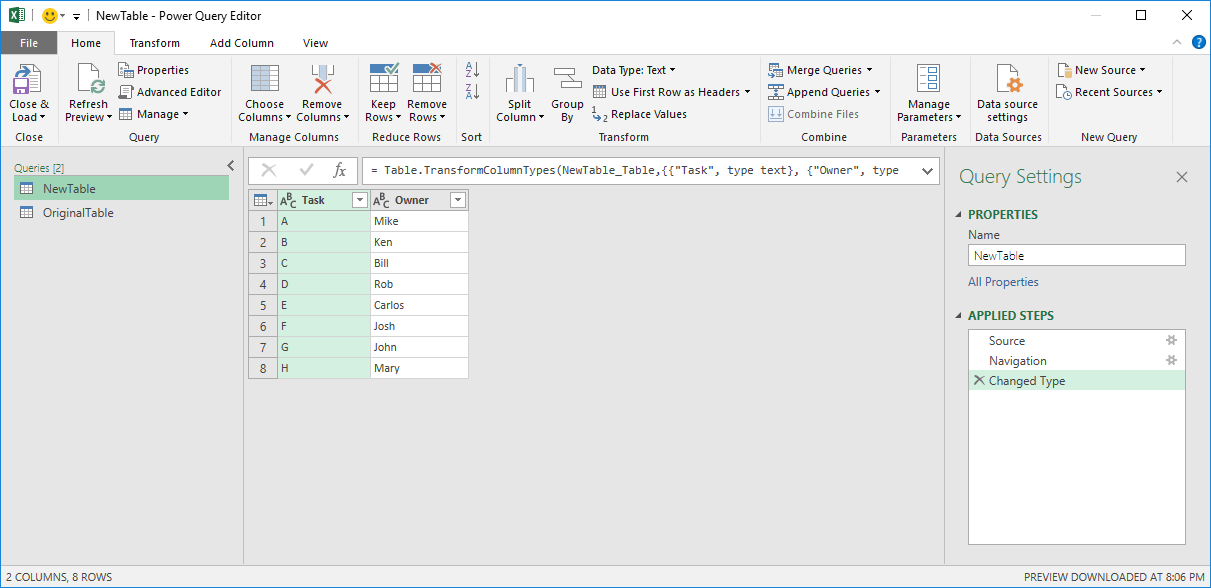
That should land both of your tables inside the Power Query editor as shown below:
Doing the Right Anti Join
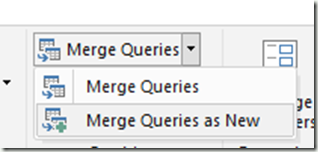
At this stage, we’re ready to click on the ‘Merge Queries’ button that you see in the top middle of the previous image. Be sure to select, from the dropdown, the option to merge queries as new.
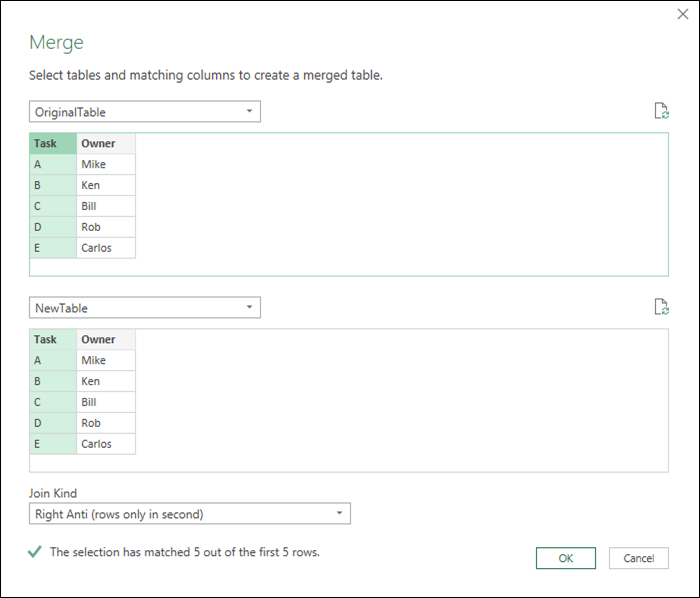
Now we get a new Window to set the Merge operation and in here we select our first table to be the OriginalTable table and the second table should be the NewTable.
For the columns that you need to select on each table, just select the Task column on both and then choose the Right Anti from the Join Kind dropdown.
After hitting OK, you’ll go back to the Power Query Editor and you should be able to see it like this:
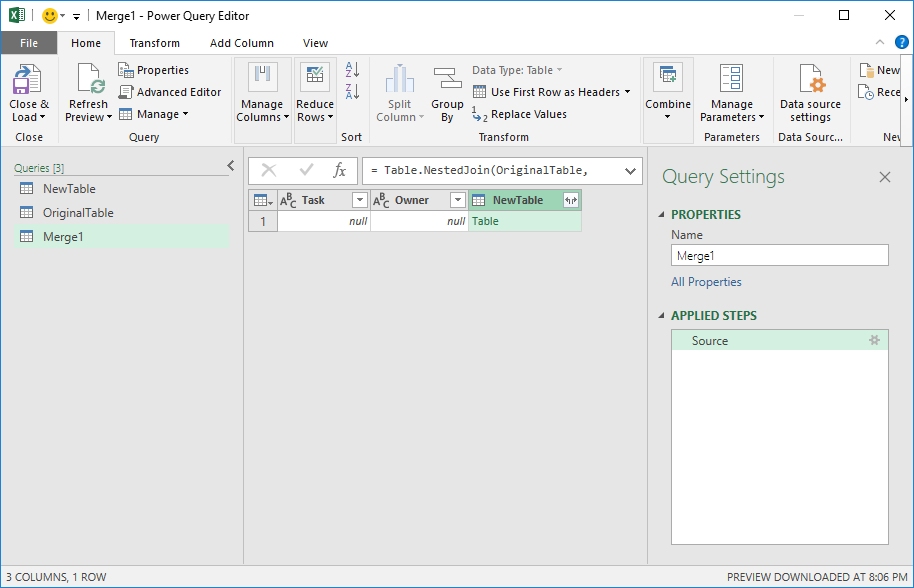
It looks pretty strange! I know, but it does have everything that we need inside that single cell with the Table value.
The reason why you see all of those null values it’s because of the type of Join Kind that we’ve selected. Remember that it reads “rows only in second” which means that no rows from the first table (OriginalTable) will show in this case, but only the ones that are not on that first table and only in the NewTable.
Expanding the Newly Created Column
Now we need to expand that Table Column that has the name of the second table as shown below:
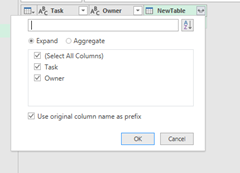
You can remove the Task and Owner column from the table and you’ll end up with this result:
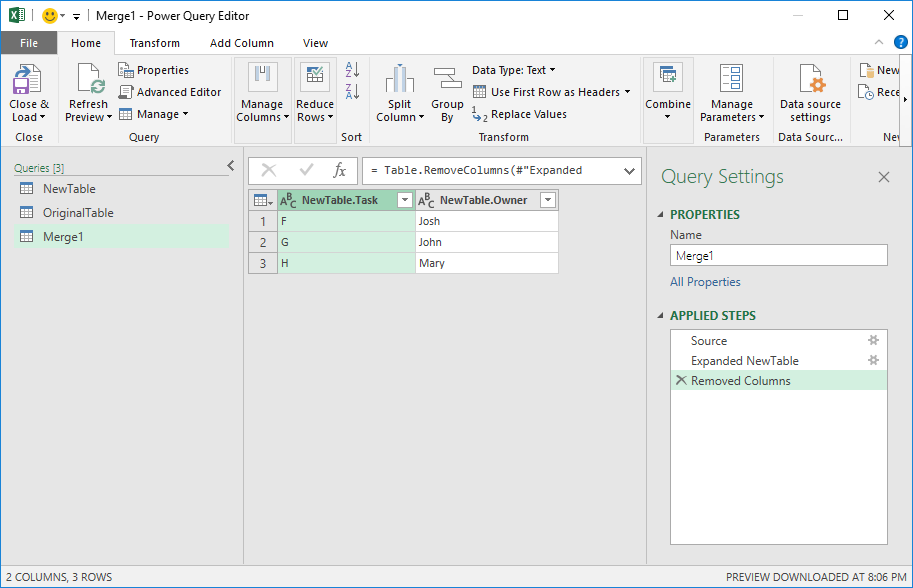
which gives us the tasks that are only on the new Table and not on the original one.
Final thoughts
You could apply this same principle / pattern to other situations where you’d like to compare the same table but in different points in a timeline to see what changed from point A vs point B.
This is more of an advanced and unique scenario, rather than something that you’d be using frequently. From my own experience, I’ve only used this around 10 times.

 Miguel Escobar Published January 15, 2019


Thanks for sharing this is very useful
Perfecto para identificar valores no conciliados en el cuadre de GL Bancos y el Estafo de cuenta Bancario.