 Miguel Escobar Published November 25, 2019
Within the past few years we’ve seen Power BI / Power Query get new features that are using Artificial Intelligence at its core.
This blog post is an overview of all of these features, what experience they try to provide and what common problems they try to solve.
Column from Example in Power BI / Power Query
AI in Power BI / Power Query first started with the “Column from Examples” feature (url) in which you can provide a sample of how you need the output value to look like based on the data from an existing column and Power BI / Power Query would be able to deliver that exact output that you need:
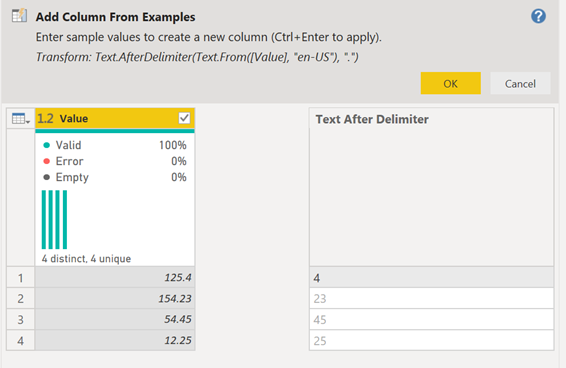
(an example on how you can type the decimals of the number and Power BI / Power Query would be able to interpret your example and create the code for you – values greyed out are the ones suggested by the algorithm)
They’ve been improving that experience ever since and it’s only getting more and more accurate with its suggestions. Not to mention that you can always look at the M code that it’s creating and jump in if you ever need to make any changes or amends to it.
Table from Example (for Web Scraping) in Power BI / Power Query
A few years ago (on mid 2018) they added this new functionality to the “From Web” connector where you can preview a webpage and be able to simply type some examples of what data you need from the webpage and Power BI / Power Query will take care of the rest so you can get the data that you need. You’re now even able to select any type of html attributes, which means that you can provide an example of the image urls that you’re looking for and Power BI / Power Query will take care of the rest (using CSS Selectors) to grab the specific values that you’re after.
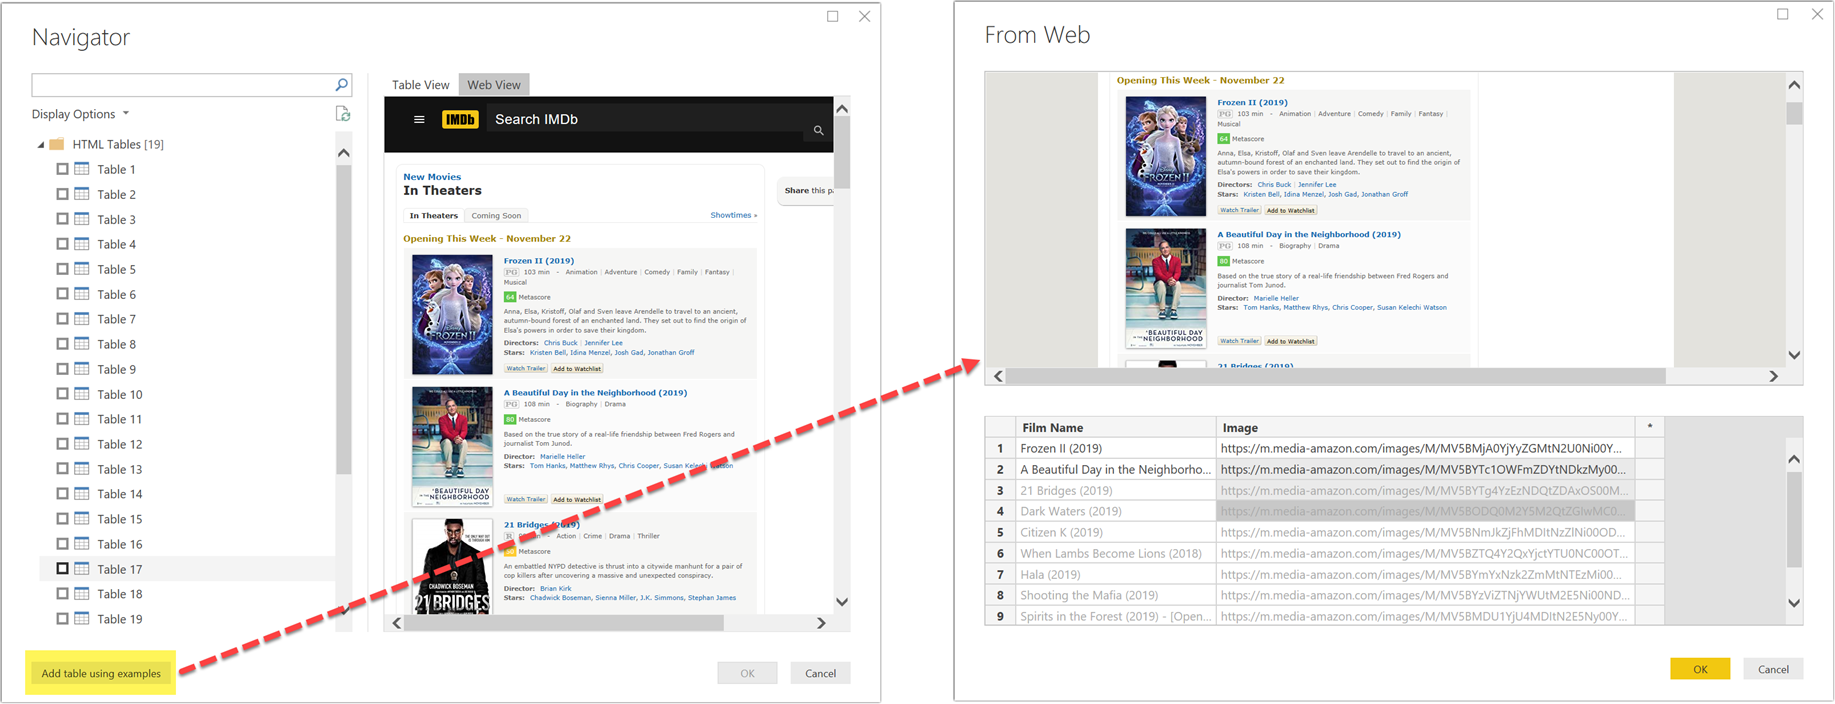
(going through the table using examples for a WebPage – values greyed out are the ones suggested by the algorithm)
New AI Feature in Power BI Desktop November 2019
Microsoft has just added to the Microsoft Power BI Desktop a few experiences that were only available through Power BI dataflows. You can read the full feature release from the official Power BI Blog (url), but I’m going to give you a general overview of what this new version of Power BI Desktop brings to the table.
After you enable these features, they’ll show up in the Add Column menu AND the Home menu under a new AI Transforms group:
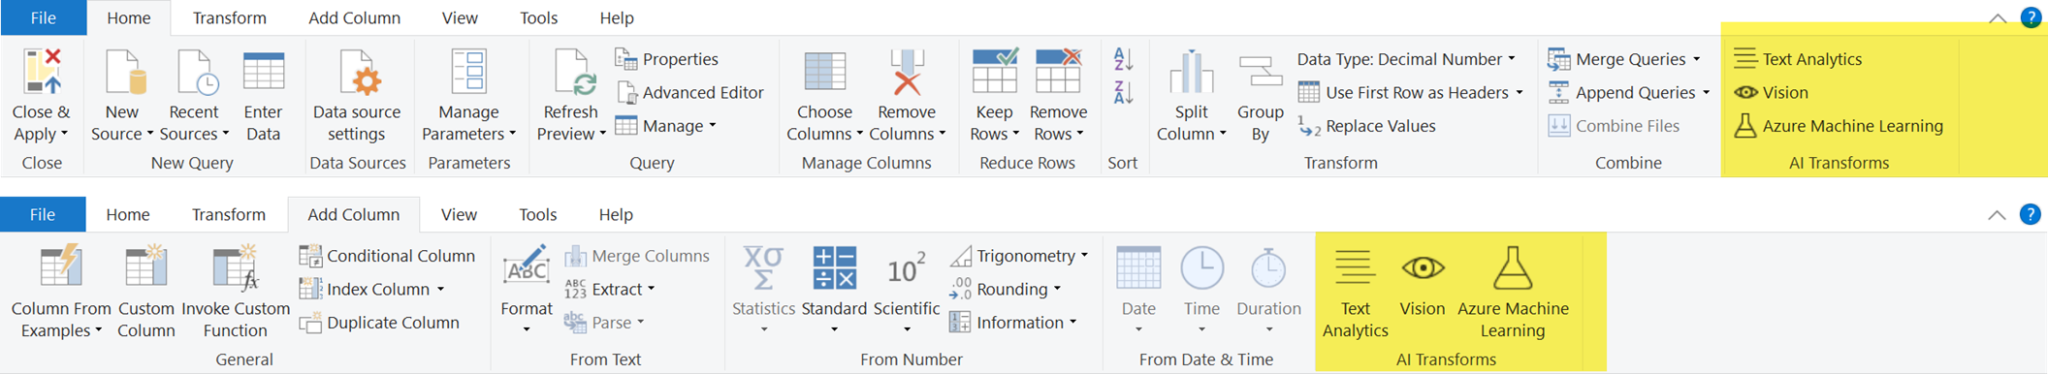
You’ll notice that these are basically 3 types of transformations:
- Text Analytics – which uses the Cognitive Services API
- Vision – also uses the Cognitive Services API
- Machine Learning – it exposes your Azure Machine Learning functions / models
Note: One super important requirement to use any of them is that you need to have a Premium Capacity on one of your workspaces in order to use these features.
These features are basically a modified version of the Connector User Experience that I’ve previously defined (here) where it exposes a set of functions that you can use against your current data.
Check more info about Parameters and Functions in Power BI / Power Query from here.
Let’s look at each of them one by one.
Text Analytics
The moment that you click on the Text Analytics button you’ll be greeted with a new Navigation and authentication window that should look like this:

Once you finish the authentication process, you can hit the connect button and then wait a few seconds until the service is able to load the available functions from the service:
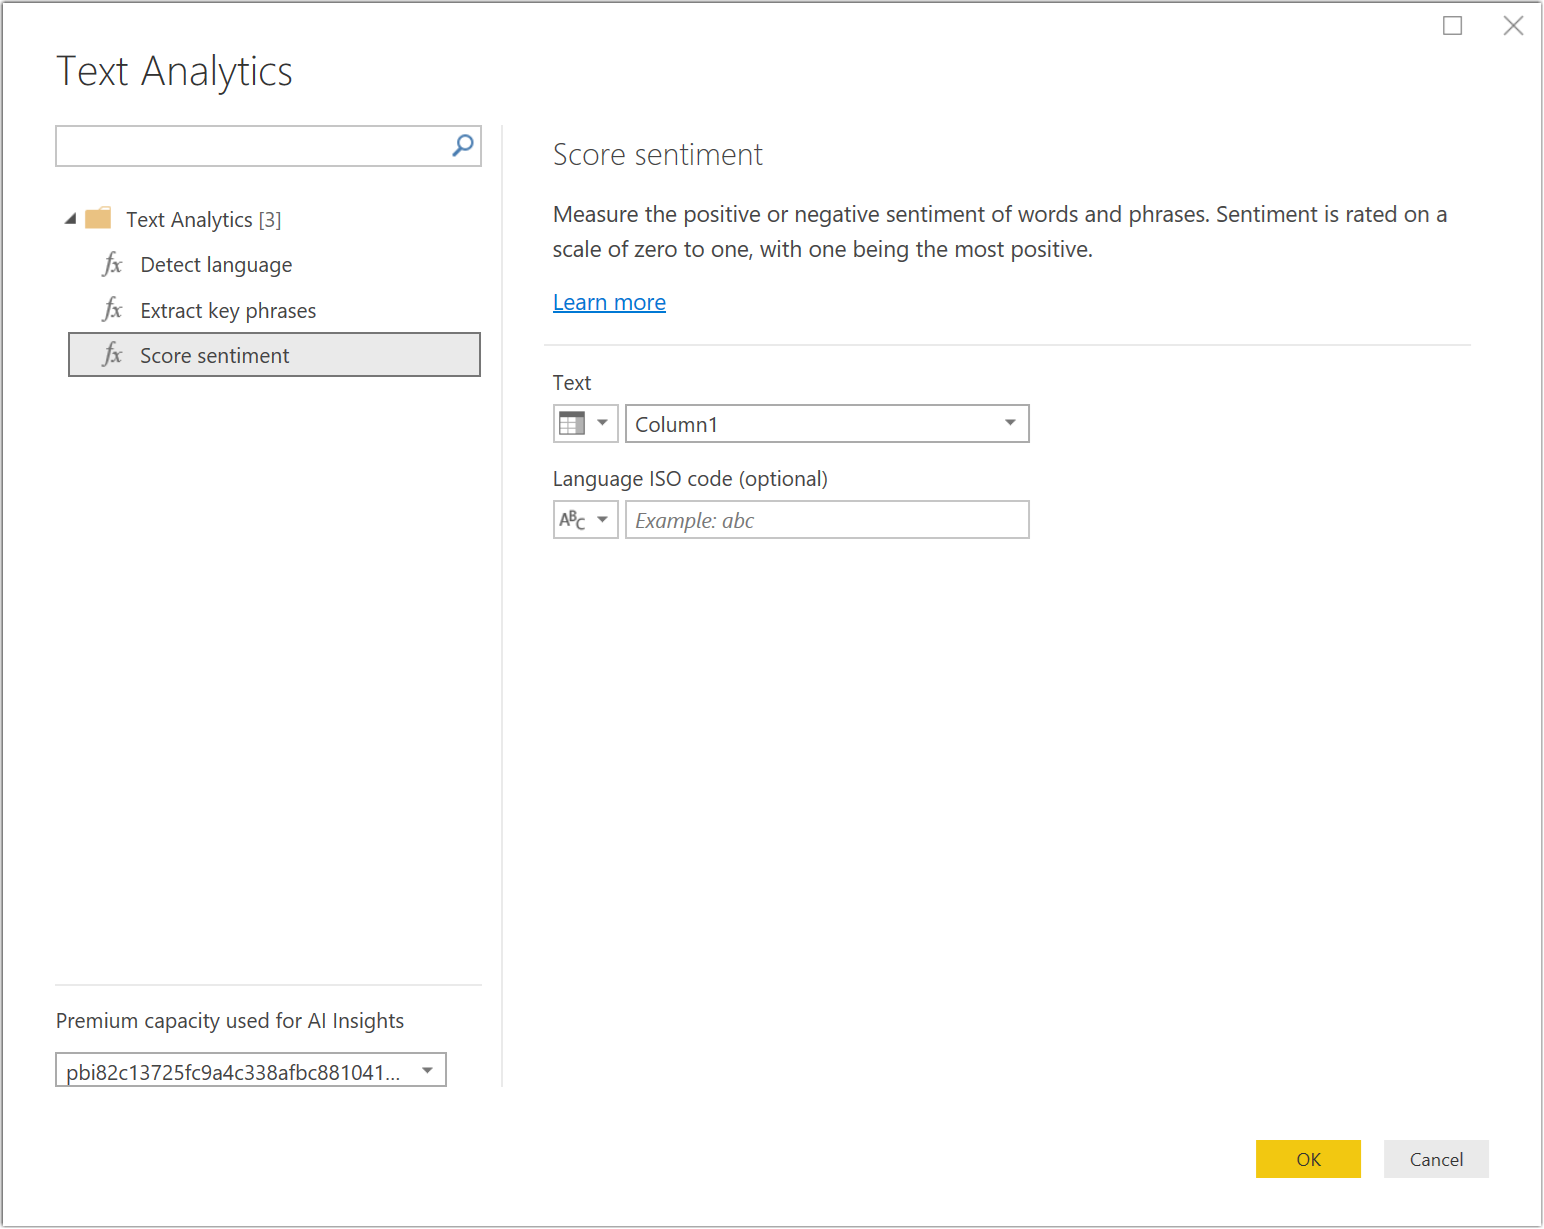
For now, we only have 3 available functions:
- Detect language – it just does that. It detects the language of a text string and give you the ISO code of the language
- Extract Key phrases – “sift through text and surface important phrases in your data”
- Score sentiment – it
calculates the sentiment score (from 0 to 1) based on the negative and positive phrases
I really wish that they would add a Translator Text function in the future so I can quite easily (and securely!) translate my text string from English to Spanish in most cases.
Putting the last function to the test, I tried this:

Just 3 text strings in Spanish, so it had to automatically detect the language and then do the score sentiment analysis and the result of that is intriguing:
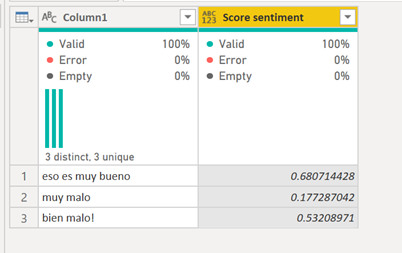
The lower the value the worst sentiment score it go (closer to 0 is negative, closer to 1 is positive).
The first two make sense, but the last one is not so good, but at the same time it’s kind of a colloquial way of say “very bad” or “quite bad” in some countries in Latin America.
Here’s the value that I have in that table and what it translates to in English:
| Original | Translated |
|---|---|
| eso es muy bueno | that’s really good! |
| muy malo | very bad |
| bien malo! | quite bad |
[/table]
I guess that what I’m trying to say is that I wish that I could pass a query (with a table value) to add my own list of negative and positive keywords / phrases to this algorithm. That would be tremendous.
Vision
Similar to what I did before, I have a sample table with essentially two image urls from the last Microsoft Ignite.
The links to those 2 images are (Image 1 | Image 2). The first one is basically the event flyer and the second one is a picture of Microsoft’s CEO Satya Nadella giving a presentation.
I’m going to click on the Vision button and let’s see what experience I get: 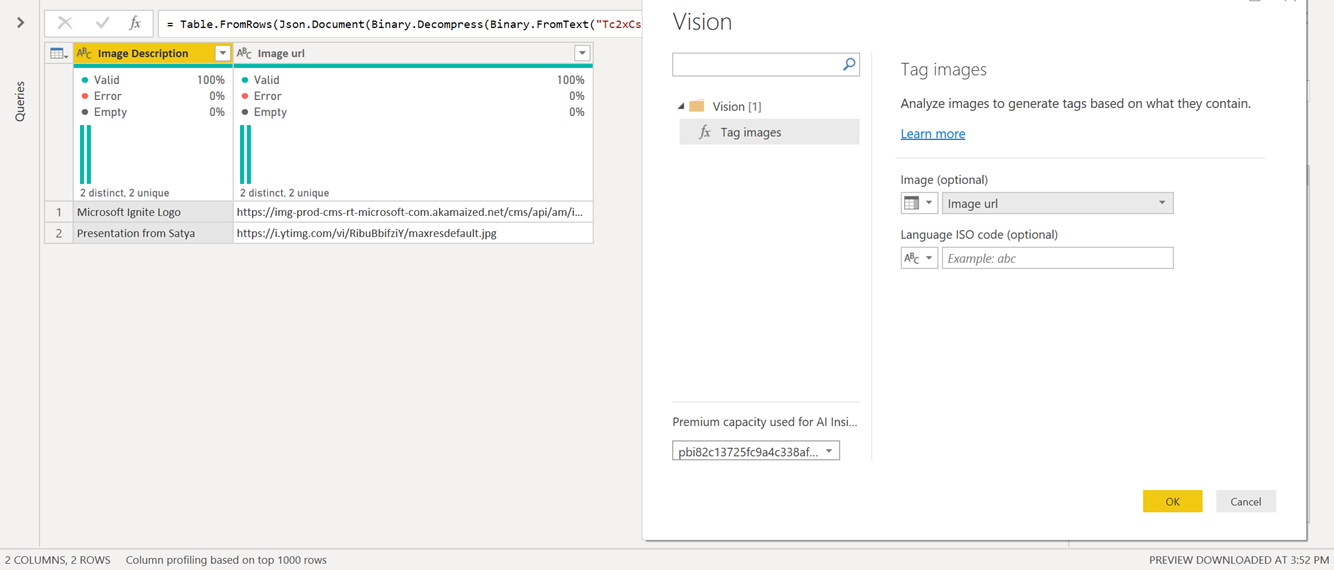
It’s one function that requires the image to be either set as a binary or an url (as text).
The result of this function is actually a new table:
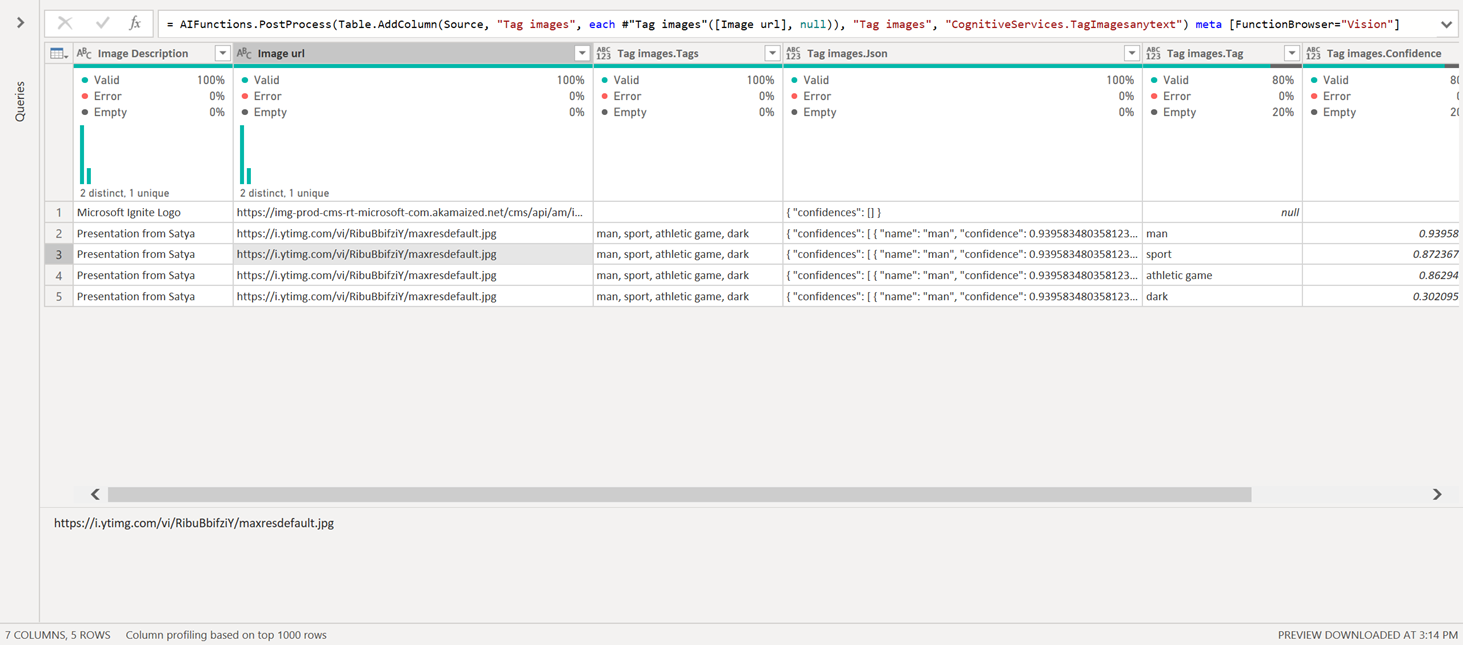
I really wish that they wouldn’t automatically expand this new column during the post processing of the response from the API, because now I end up with 1 row for every tag that every image has. I wish that I could do that on my own by having the json field be a record instead of a text value (as you can see on the Text Images.Json column).
Nevertheless, the function appears to be working. I still need to dig deeper into the use case of this one, since I’m not entirely sure of what tags are available to be assigned to an image, but it’s nice to know that this is possible and it determined that there was a person in the second picture.
You can read more about image tagging and how it works from the official documentation (here).
Azure Machine Learning
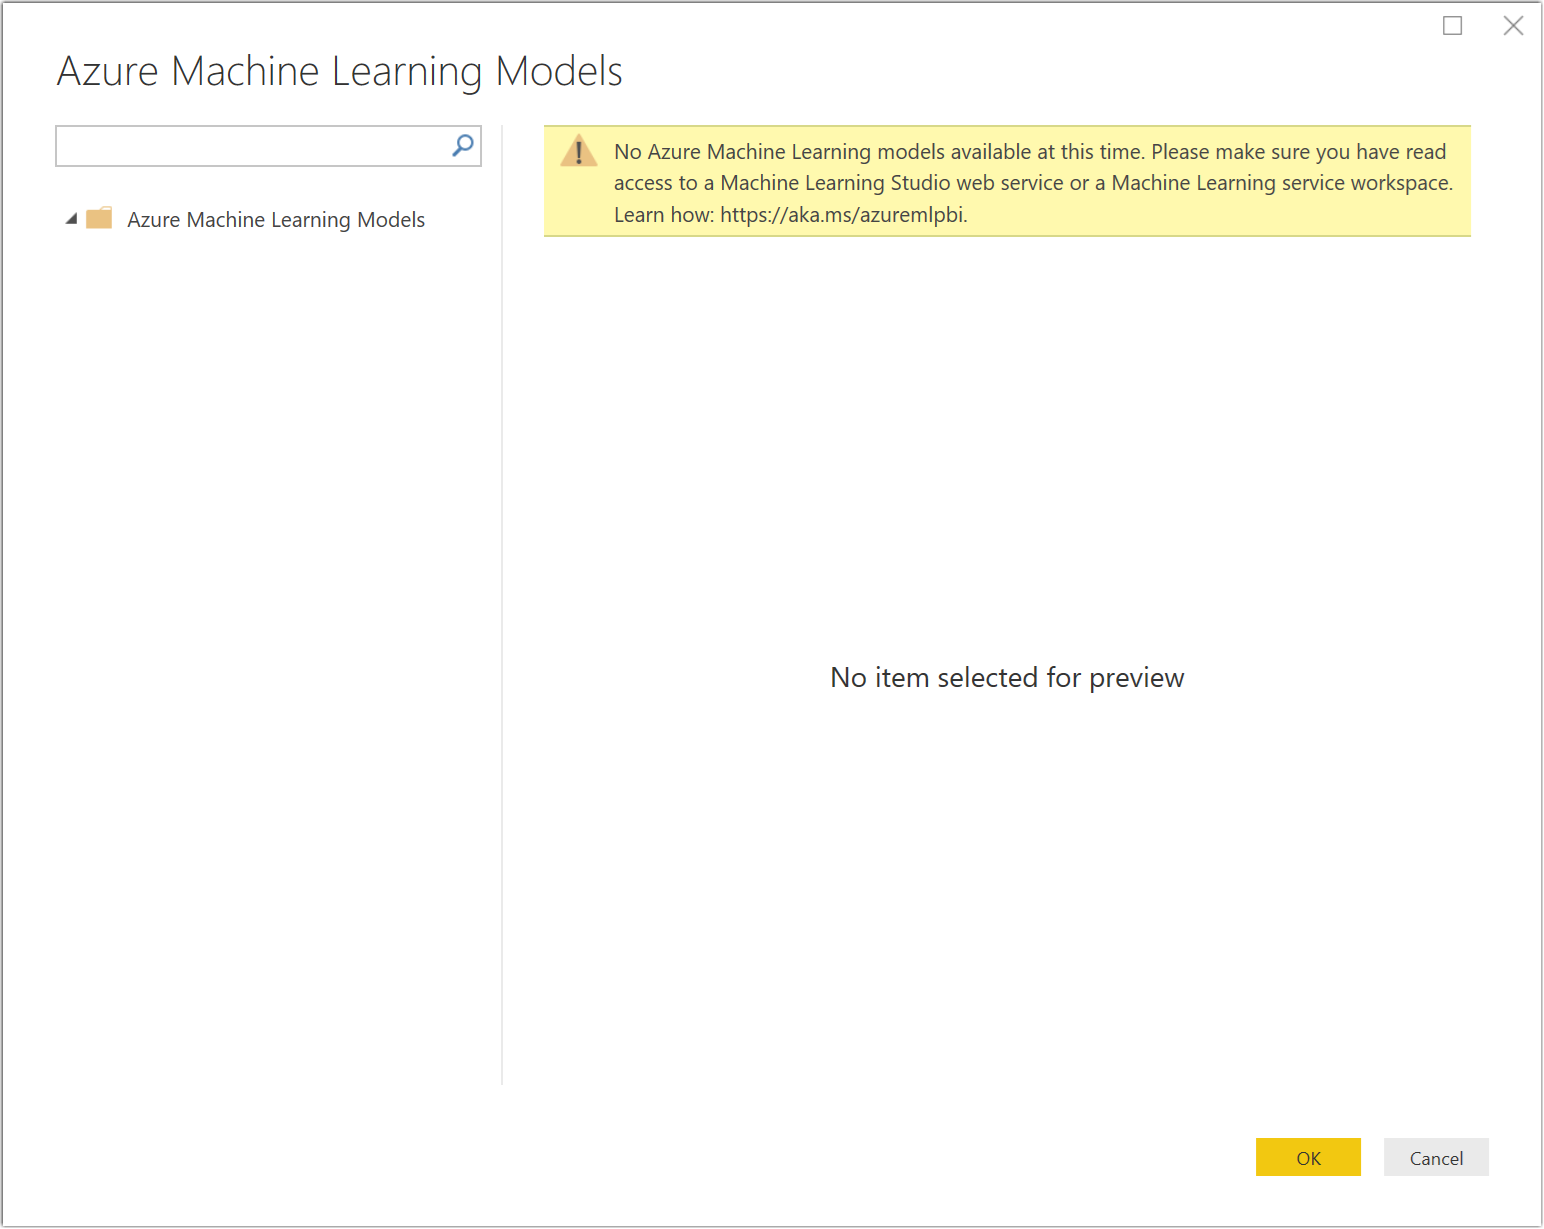
The last option is for Azure Machine Learning, but if you don’t have any models / functions that you can use then it’ll just give you an error like the following one:
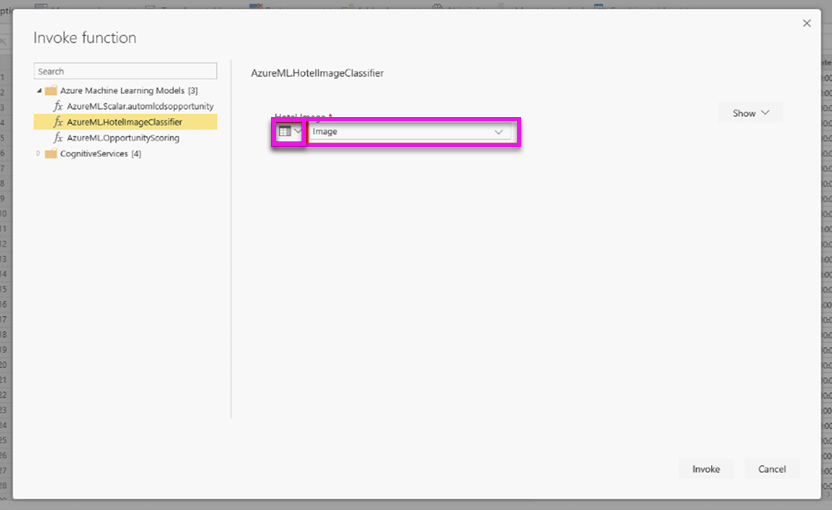
However, if you do have any model then it’ll show like this:
If you still can’t see anything, I’d highly recommend that you read the full documentation about this feature from here.
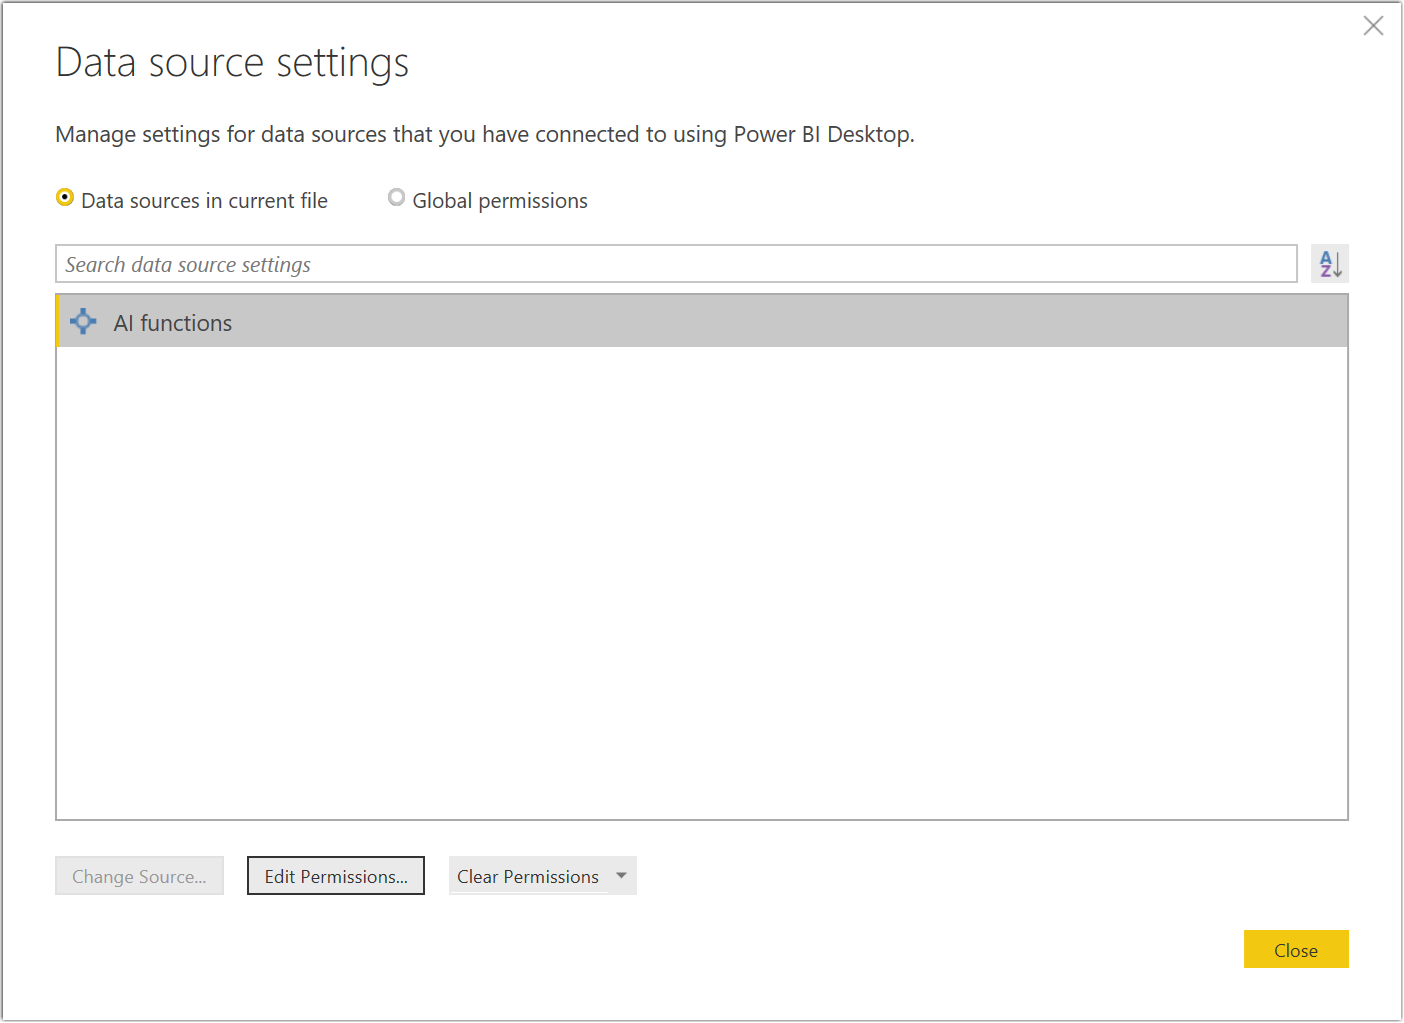
About the authentication for these features
Here’s comes the extra steps for consultants and other users that work with multiple accounts / tenants at the same time. I initially had to authenticate with an account that has Premium capacity, but I don’t have any models under that one, so if I want to change to another I need to go through the Data Source Settings window like with any other connector and go there to change my credentials:
You can read this full blog post that goes in depth into how to change your credentials inside of Power BI / Power Query.
Conclusion
These are exciting times! If you have Premium capacity then I’m really jealous of you as this will only get better for you and I can imagine that Microsoft is working behind the scenes to enable more integrations / features like this one in the future where you’ll be able to simply invoke one of the Azure service on top of your data with just one single click – no more tedious setup. This is the dream for any business analyst.
Let me know in the comments section below what you think about these new features.


Thank you so much Miguel. very well explained. your tips and tricks really help me a lot in my daily day to day working.