 Miguel Escobar Published December 19, 2019
The following is a pretty common scenario that I’ve seen with flat files exported from legacy systems, but it also applies to multiple other scenarios. It uses the M language inside of Power BI Desktop / Power Query, but you can follow along without knowing that much about it.
The scenario: a table that contains multiple segments or partitions
Imagine the following table:
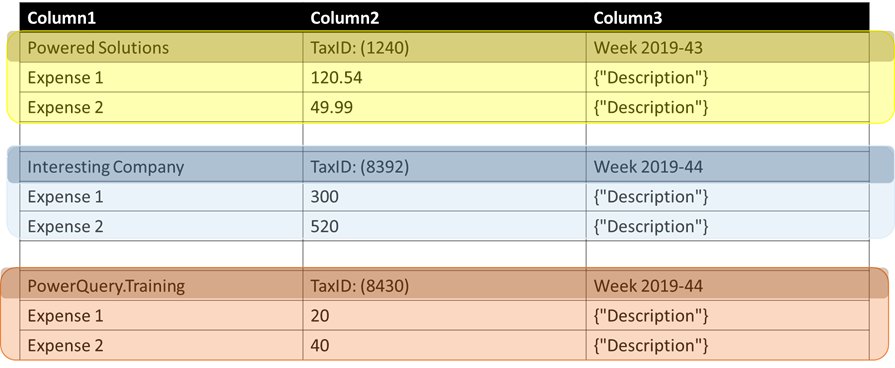
It has 3 columns, but within the rows of that table we noticed that there’s a repeating pattern. Every 3 rows there’s a first row that contains what it’s commonly called as a header row and then underneath we have 2 values.
In our specific case, the system will always export the file with a symmetrical number of rows for every “section” or “segment”.
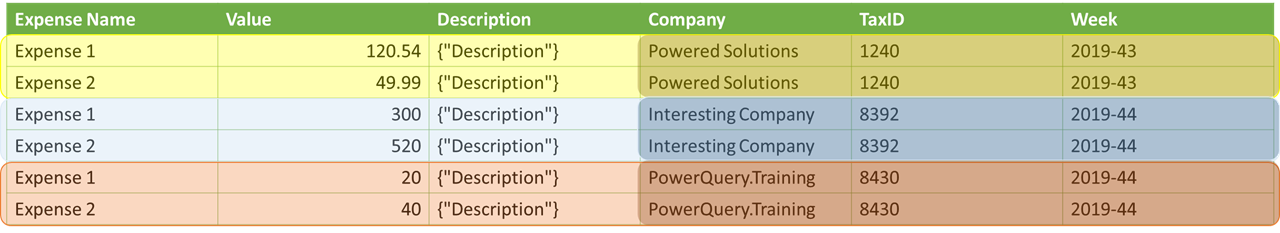
At the end of the day, what we’re trying to reach is the following output:
The solution: Split functions to the rescue
You can download the sample file by clicking on the button below:
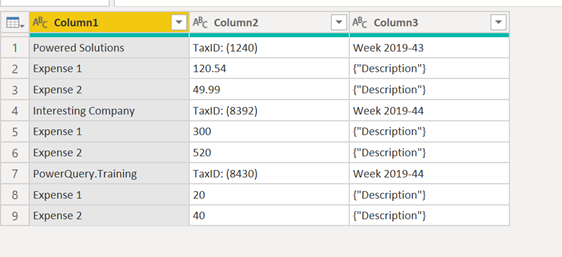
Don’t forget that we’ll start with a table that looks like this:
Step 1: Splitting your table into multiple smaller tables of the same size
Since our first step in our query is called “Source”, all wee need to do is apply the formula Table.Split( Source) as a new custom step (by clicking on the fx button in the formula bar) and that will look like this:
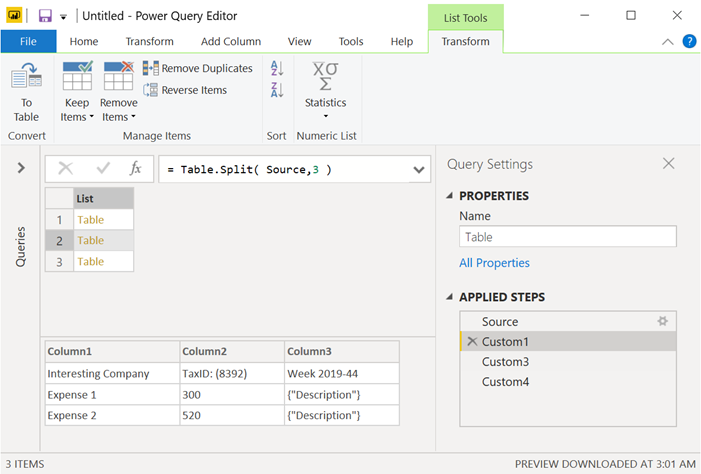
This essentially transforms our table into a List of tables where each value in that list is basically a table. The #3 that you see in that formula it’s because our pattern stated that every 3 rows there was a new “record” or “object”.
The reality is that in Power Query it’s always easier to target things at a much granular level rather than trying to apply a function that should take in consideration a large number of unknown variables. By dividing or splitting this into smaller pieces of tables, we’re able to create a much faster approach and way easier to understand.
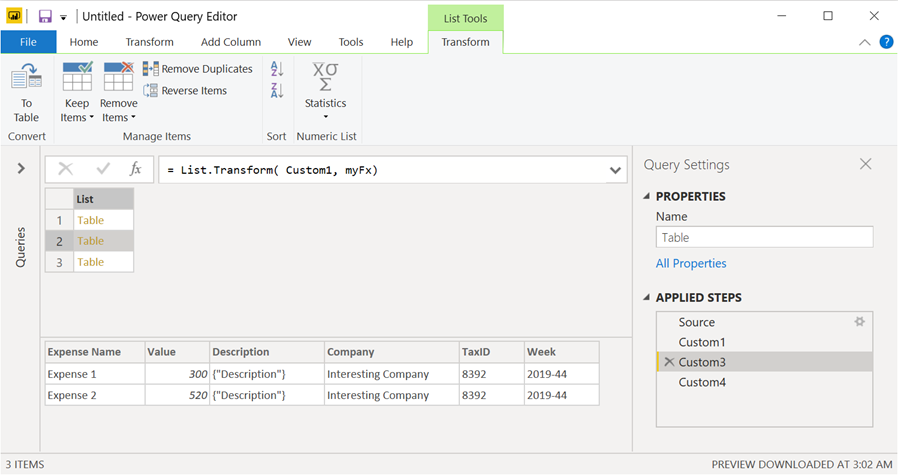
Step 2: Using a custom Function against the tables in the list
I already have a function inside the file called myFx which will transform every table inside of that list into the table that we’re looking. To make that happen we create a new custom step and enter the formula List.Transform( Custom1, myFx) which will apply our custom function to every element in the list.
The result of that looks like this:
Step 3: Combine all tables
This is the last part and probably the easiest one to understand because it’s something that we’ve seen before in this blog. We have a list of tables and right now what we’re after is for a way to combine all of those tables into one single table.
The easiest way is by using the Table.Combine function as shown in the next image:
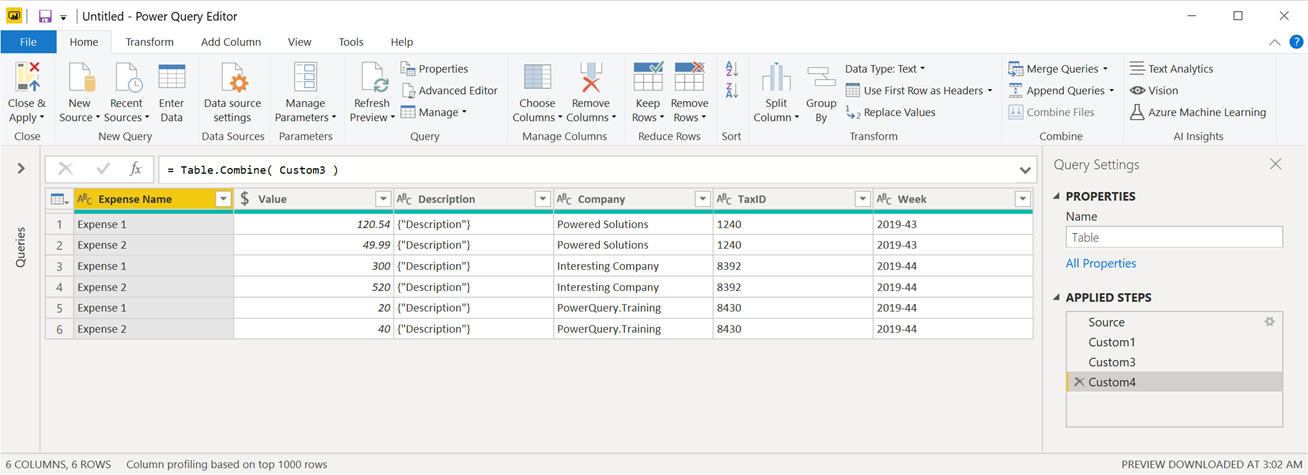
And just like that we have the output table that we’re looking for.
About other patterns for this scenario
You may have noticed that this scenario could also be solved with some patterns that Ken Puls and myself have published in our book ‘M is for Data Monkey’ where we use things like an Index Column, Module, Integer Divide and others that are out of the box buttons in the Power Query UI.
Those are still valid and are preferred for new to intermediate users, but if you’re going for the best performance possible, then using the Split functions would be the best way to go by far. Note that I’m saying Split functions because we just saw Table.Split, but there’s also List.Split.
I even jumped on a call with Ken about how to use List.Split and he was pretty excited about this function when I showed him what we could do with those, so expect a few more blog posts from myself and Ken about an update to our book patterns that are blazingly fast.
We will most likely be adding these new patterns to our Power Query Academy as videos and to the Power Query Recipes, so be on the lookout for those.


Thank you so much. Very handy indeed.
Very good. I’m a programmer, so always nice to see a “clean” way to do transforms in Power Query, although as you say, for newer users I’d be inclined to use GUI, even if it is more complicated.
So how would you handle this scenario with the same data but with the tables going to right (vertically) the with blank columns between them?
meant to say horizontally instead of vertically but hopefully you get my meaning
Good question! Got a sample of what you’re looking for ? I’d probably start with Table.ToColumns and go from there with List.Split
Muy buen trabajo Miguel, felicitaciones!
Is there a way to do this in reverse? Management wants the first table, but data is coming in like the last table.
It is possible, but not really easy to do with power query. You should probably try using a pivot table to create the report that you’re after instead
Can you expand on step 2, please? How and where exactly did you create the myFx function? I tried downloading the sample file to further understand this entire process, but I am unable to open it as it’s a pbix file?
Hey!
That’s correct. You need Power BI Desktop to open the pbix file.
The myFx function could be anything, and I didn’t mean to go deeper into it as it the main focus of this article is the usage of Table.Split.
From a purely conceptual standpoint, myFx is the function that will transform your data to however you need it to be – it can be anything that you want as long as it gets you the transformation that you’re looking for. The real important part of this article is the use of Table.Split since it’s the only function that can split your table into equal parts.
Thank you for this article. It’s really usefull.
I have one problem that I want apply some transformation to each table after split it, but I dont know how to mention the Table ( after split it ) on my function. If you can share with us please myfx it should be so easy to more understund how you did in this important step.
Thank you so much
Hey!
There’s a download button in this article so you can download the pbix that contains the full M code. In there you’ll find the function that I created (MyFx), but it’s not optimized whatsoever.
If you require assistance with creating a custom function for your own scenario then I encourage you to post your question on the official Power Query forum using the link below:
https://docs.microsoft.com/en-us/answers/products/pwrqry
Great post! Now, what is the solution to a similar case if the system does not emport the data in this pattern? How can we achieve a solution if there was a different number of rows for each company?
it depends!
The first thing would be to find the pattern and then come up with a plan based on that pattern. List.Split and Table.Split work based on “paging” meaning that every ‘segment’ or ‘page’ in the output would have the same number of rows, so it wouldn’t work for that the scenario that you’re mentioning and a different approach, based on the pattern found, would be needed.
hi!
i have question what about if I have table that I should splitting in to tow table
Table colA and Table colB to append them( I faced this issue)
thanks
it really depends on your scenario! it’s hard to say without looking at your data or what you’re trying to accomplish. There might be other patterns / technique that could benefit you the most or simply reference the same table twice in two different queries, do the transformations that you need in each of those queries and then append the results of both of them into a new query.
I’d suggest that you publish your full scenario and expected output on the official Power Query forum using the link below:
https://community.powerbi.com/t5/Power-Query/bd-p/power-bi-services
thanks for your clarification
Great article. How do you handle a situation where every table has a different amount of rows associated with it ? so it’s not static in a way and doesn’t always have 3 rows ?
In such cases you’ll need to create something that will identify them, separate those rows somehow and then apply this technique to each of them separately with the number of rows defined for each case