 Miguel Escobar Published January 11, 2020
One of the most frequent patterns that I most vividly remember using back in 2012-2013, in the PowerPivot days, was a pattern now called “Segmentation”.
It can be dynamic or static, but it all relies on a table that looked like this:
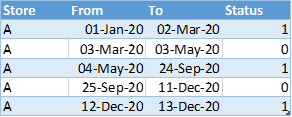
And then we would use one of the techniques that you can see either here or here to do the segmentation with Power BI / DAX.
If you have the table in the format above then you’re good to go, but…
What if you don’t have your table in the format above?
You need to conform to that format where you have a From and To columns that will define your range. You could implement some clever DAX filters to make things work, but it’s usually a better idea to conform to the format showcased above.
So, how can I go from a table where I only have the “From” column and I need to create the “To” column:

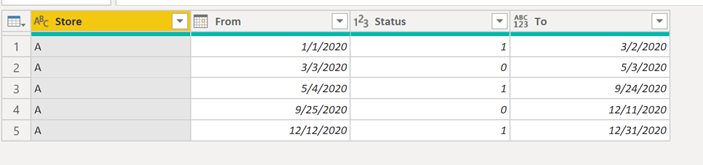
The Scenario: Status of a retail store
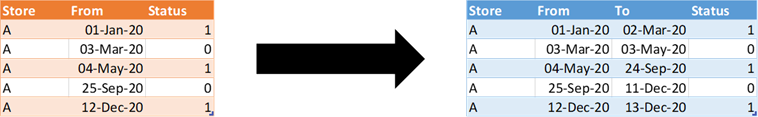
The end-goal is to conform to the format that the dax pattern showcases. It’s easy and quite straightforward from a pure DAX standpoint.
The reason why our table in orange has this structure it’s because this is more of an event table than anything else. A Store can have multiple statuses. For our case, let’s say that we only have 2 statuses:
- 0 – store is closed || can be for modifications of the store, natural causes that drove the closure of the store or other events)
- 1 – store is active
In most cases the store will start with a 1 and never change, but in some cases we’ll have to record an event in the Store Log Sheet (in Excel) and place the date when the event took place and the status that we’ll be switching it too.
That’s how the orange table came to be. How do we transform that into the blue table?
A function to transform a table
I’ll first start by creating the solution from a new query and then I’ll transform that into a function to make it portable.
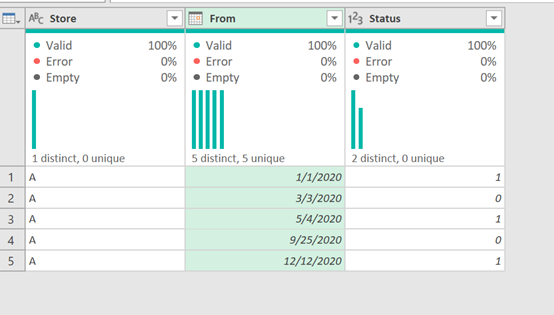
Load the Table
First things first! Let’s get that table inside of Power Query:
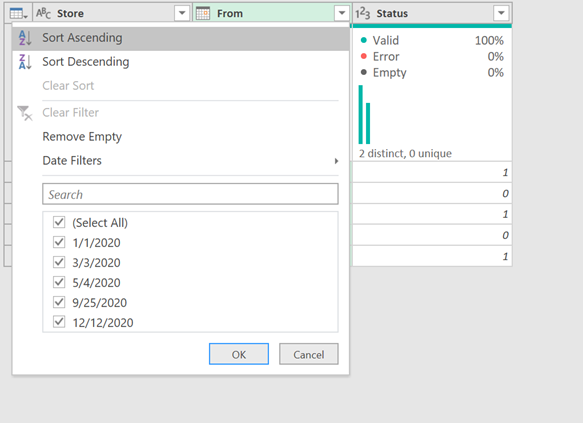
Sorting the data
Now let’s make sure that we have the correct sorting. Assuming that we only have one store per table, all that we need to do is sort by the From Column in ascending order:
Adding helper columns
The next step is to add 2 new columns.
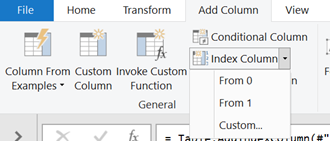
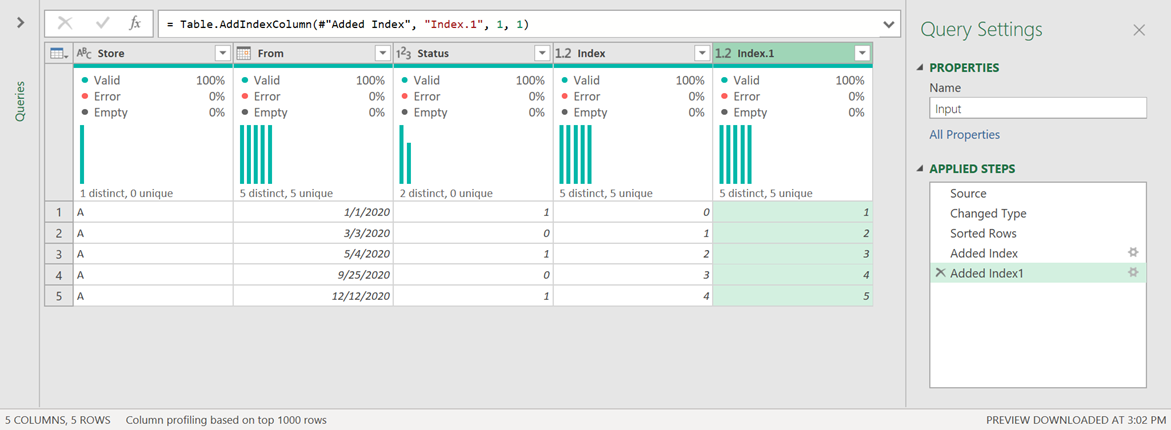
These will be index columns where one will start from the number 0 and the other from the number 1.
The result of that should look like this:
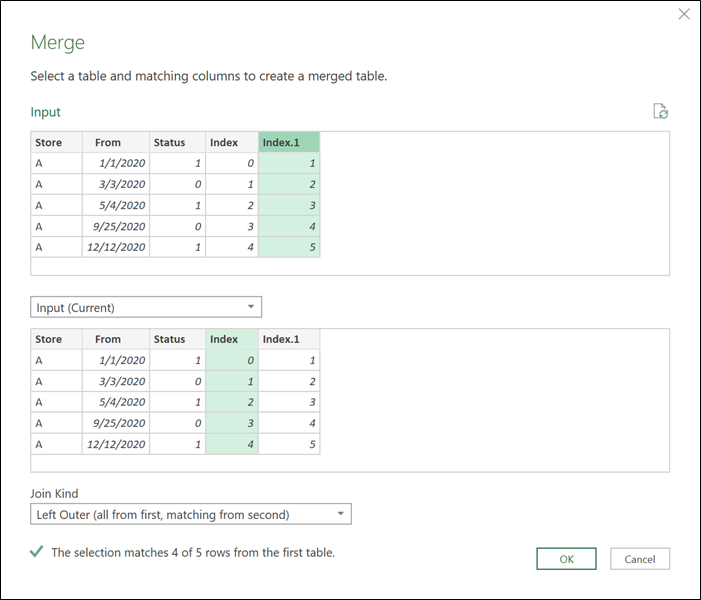
Doing a self-merge
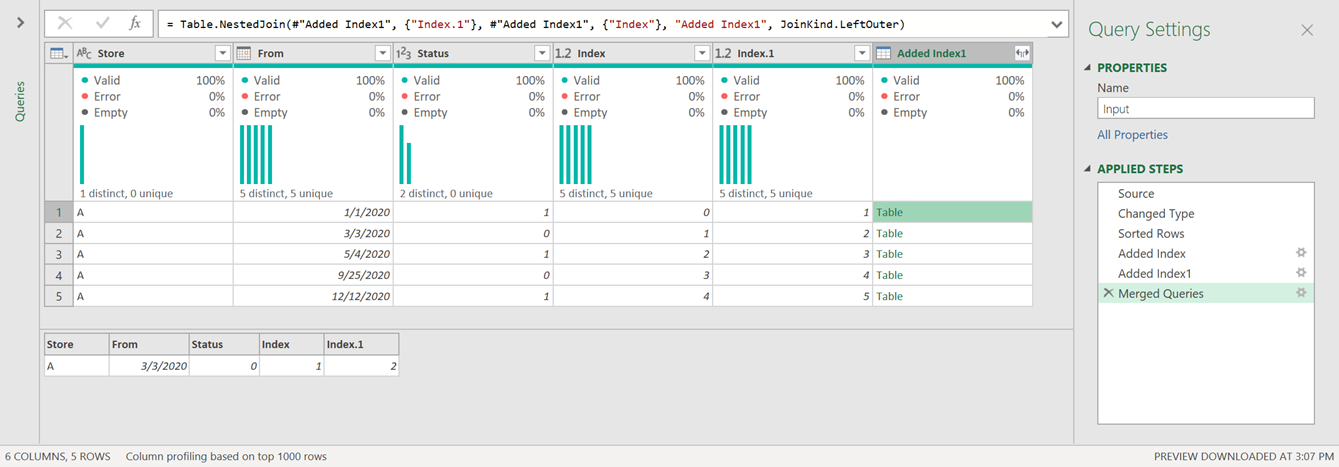
Here’s where the magic happens. We’re going to do a merge with the same step of the query using both index columns as shown below:
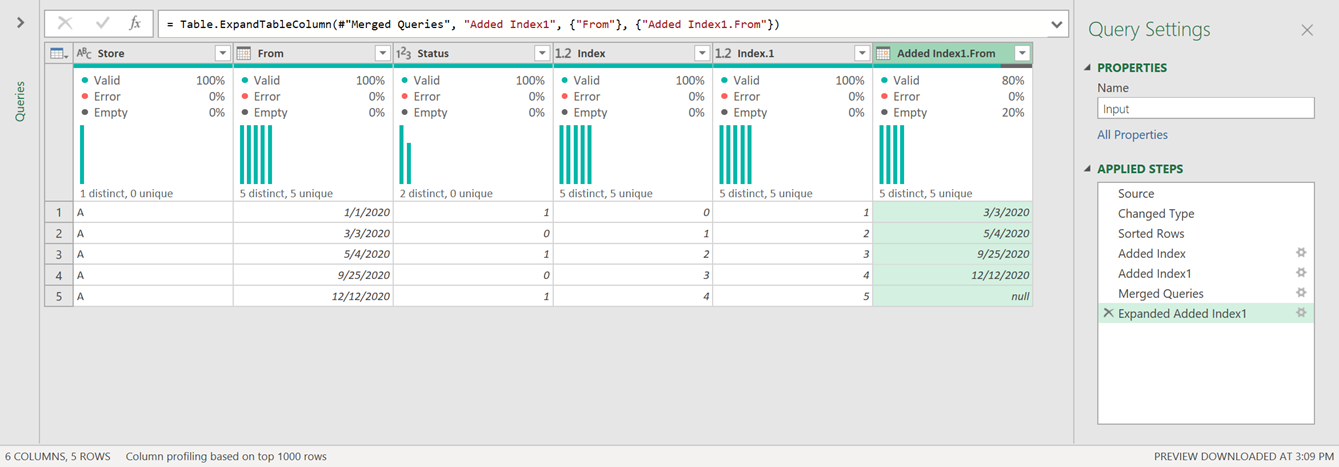
The result of that operation will yield a new column that contains the value of the “next” row:
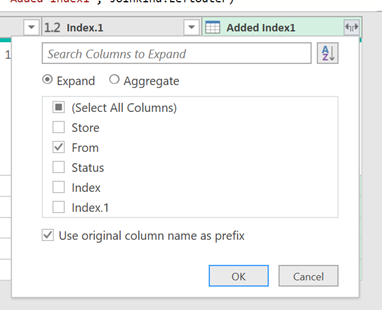
We can now go ahead and expand that column of table values to only get the “From” field as shown in the next image:
And the result of that should look like this:
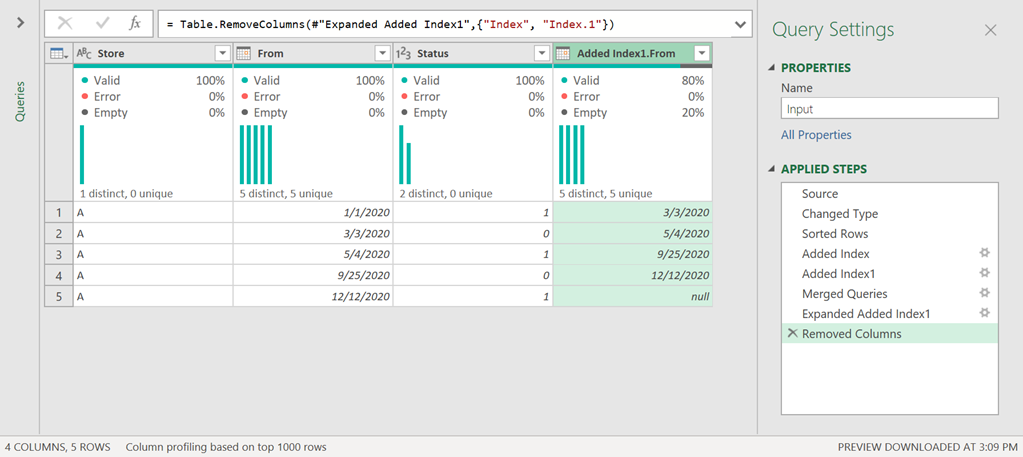
Remove unnecessary columns
Before we move forward, let’s remove the index columns as we no longer need them. After you remove them, you should be able to see a table like this one:
Inclusive or Exclusive Dates approach
Depending on how you’d like to implement your DAX filter, you may want to have the “To” date be exclusive (<) or inclusive (<=).
This step is completely optional, but if you ever need it, then you’ll know how to tackle it.
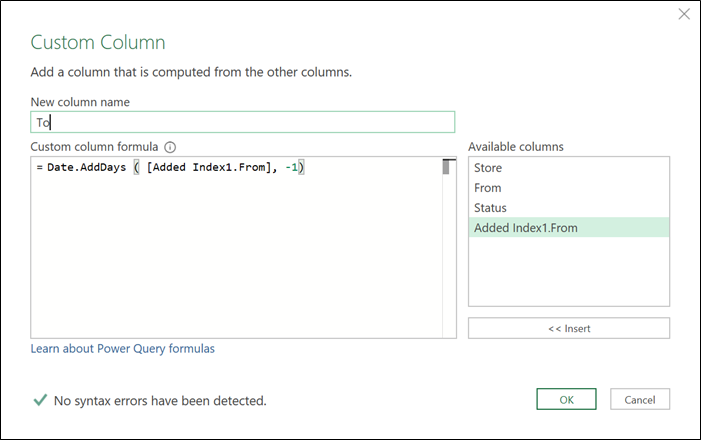
Let’s just say that we need to change the value from the expanded From column by subtracting one day from it. To do that we’ll be creating a custom column using the Date.AddDays function as shown below:
After removing and moving some columns, the result of all of that will look like this:
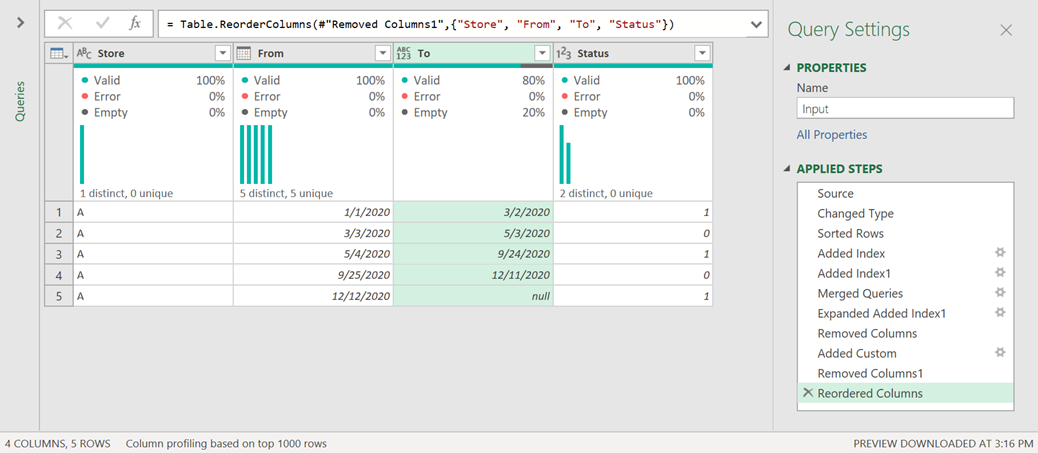
One more thing that we need to do is define how we’ll handle that null value on the To column. The easiest way is to replace that null with a date of your choice.
In my case I’ll replace this with a really futuristic date:
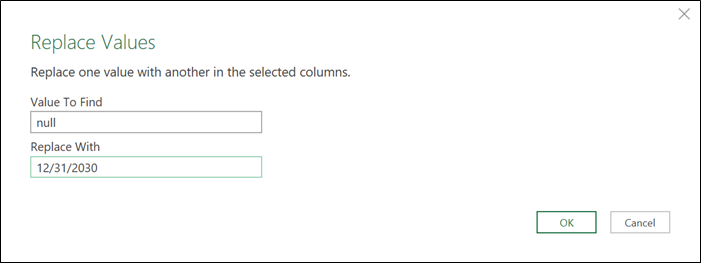
And with that done, we can set the data types of our columns and have our final table ready.

Transforming this into a function
I went ahead and creating my function which looks like this:
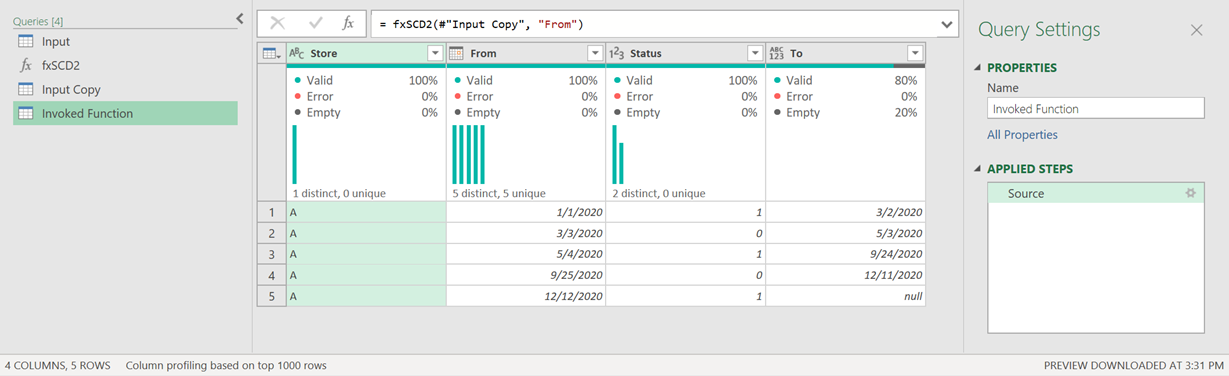
And all I need to do in that function is input x (the table that has my data) and y (the name of the column that has the dates). That should look like this:

And once invoked the result will look like this:
A pure DAX alternative
Now, let’s just say that you don’t want to conform to the table structure / format given by the guys from SQLBI.com. You could still use the same format that we get from our data source with only the upper date limit and use it in DAX to yield the correct result.
Here’s an example of how that would look like with 2 tables that have no relationships between each other.
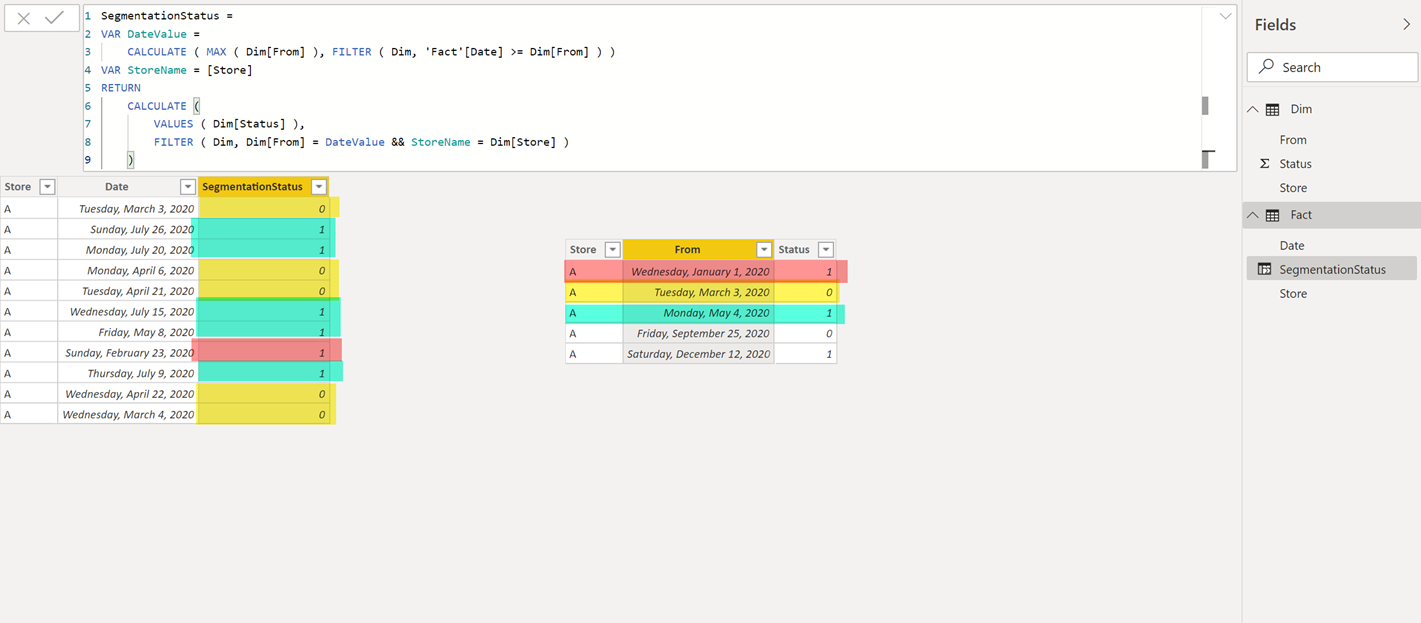
That code looks like this:
Segmentation =
VAR DateValue =
CALCULATE ( MAX ( Dim[From] ), FILTER ( Dim, ‘Fact'[Date] >= Dim[From] ) )
VAR StoreName = [Store]
RETURN
CALCULATE (
VALUES ( Dim[Status] ),
FILTER ( Dim, Dim[From] = DateValue && StoreName = Dim[Store] )
)
What about other Power Query alternatives?
We could mimic the Filter context applied in DAX but in the Power Query Language (M Language) using a function called Table.SelectRows, but I can tell you from experience that the performance using that function is terrible.
Soo…what other alternatives remain? The main situation is that in SQL we could’ve used something called Theta joins to mimic the DAX Filter Context, but we don’t have that type of joins in Power Query. Instead, the joins that we have available are the ones that I covered in my series almost exactly a year ago (1 | 2 | 3 | 4 | 5 | 6).
This means that we would need to conform to a table that will enable us to do a Left Join. How do we do that?
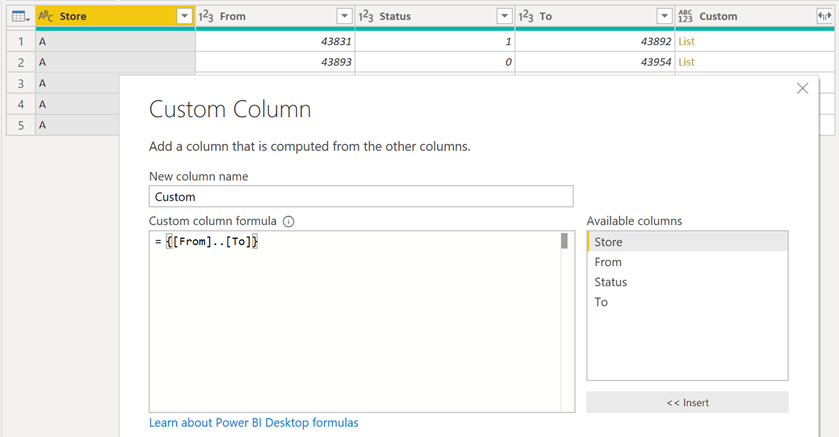
Create the lookup table
Imagine that we start with a table like this one:
From there, we change the data type of the “From” and “To” columns to be of the integer type. Then we go ahead and create a custom column that will yield a list of number using the values from the “From” and “To” columns like this:
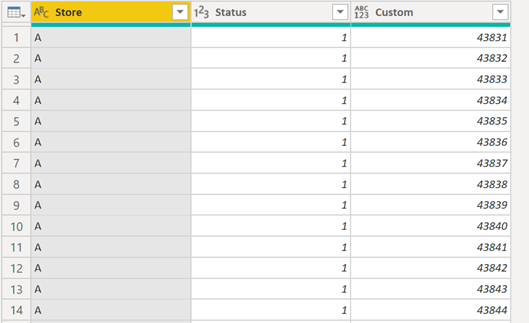
On this newly created custom column, go ahead and click on the expand icon and select the option to “Expand to New Rows”:

After removing the “From” and “To” columns, we end up with this:
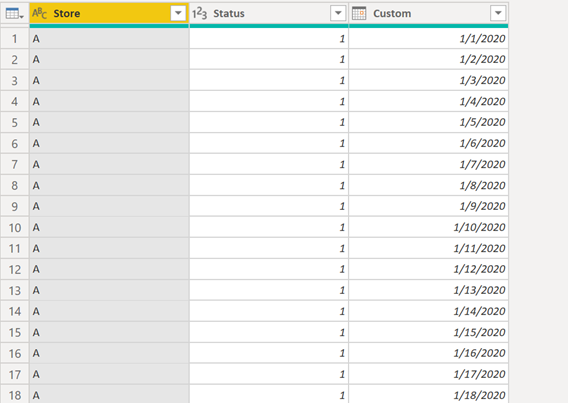
Go ahead and change the data type of the custom column to be of the date type and the result will be like this:
Doing the Merge with the Fact table
All we need to do now is join our fact table with our newly created lookup table that I’ve named “PQTableForJoin”:

Here I’ve joined the tables using 2 columns (store and the date) and with a Left Outer Join.
And the result of that looks like this:
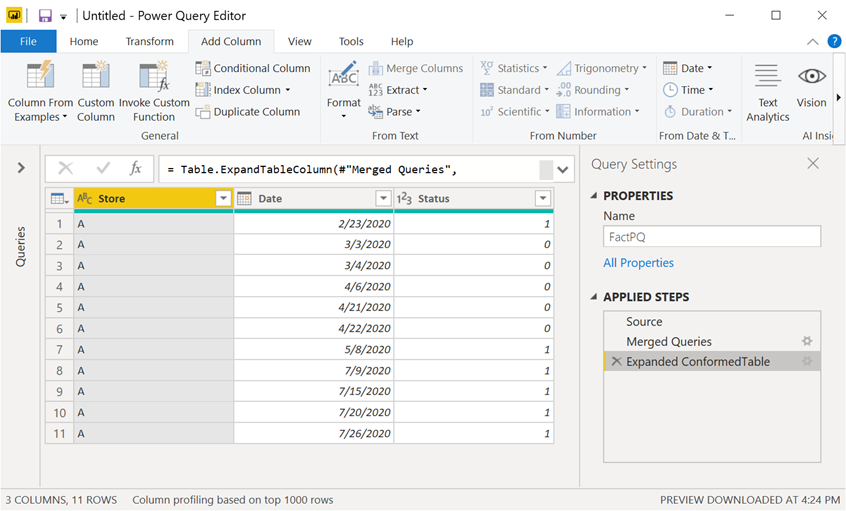
Now with that in place, we no longer need to load any other tables rather than just the FactPQ query.
Which approach is better? DAX or M (Power Query)?
Hands down Power Query is better for the static dynamic segmentation.
Don’t take it from me. Check out what Marco Russo says:

Take all pieces into consideration. Don’t only analyze the time that it takes to load or calculate the data, but the impact it also has on your overall model.
This article from Marco explains you the impact that a Calculated Column (DAX) has versus an approach taken purely with Power Query.
I do highly encourage you put this to the test so you can see it yourself. I’ve been looking at more and more articles coming up lately that talk about the compression on DAX Calculated Columns.


Most Excellent!!
Tips and tricks like this mean the difference between optimal and mediocre performance. With small datasets and projects, maybe the difference is not material. Experience has taught me that datasets never get smaller and projects never get simplier. It is better to design for more of everything from the start than having to rebuild later.
there have been some ocassions where some customers would rather have the refresh time to be as quickly as possible. In those cases it’s better to just make things happen with DAX instead of M.
Very good article. Thanks Miguel!
That’s great Miguel.
How about M vs VBA?
Good question! Sadly, Im a total newbie when it comes to VBA so I wouldn’t be able to compre the two
Thanks Miguel. No problem.
Hi Miguel,
Have been reading your blog and learning a lot!
I want to ask are there situation where one would use excel power query over power BI or the other way round?
Since I have been using excel power query almost all the time.
I wonder what would be the advantage of using power BI over excel power query?
Thanks!
Hey!
Probably the connectors available in Power BI that we don’t have in Excel such as google analytics